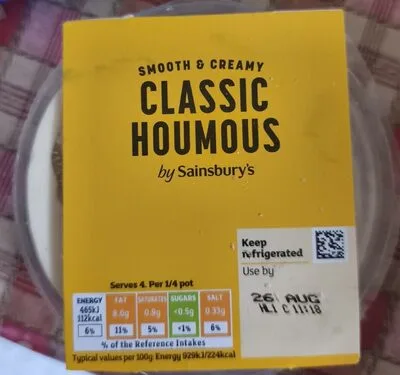
Classic Houmous
Sainsbury's · Classic hummus
77Good
1 additiveNOVA 3
00349215 · 200 g
Ingredients, most to least
Mostly cooked chickpeas (52%), water and tahini sesame seed paste (13%).
A percentage with ≤ in front of it is a ceiling, not a measurement: the most that can be in the pack, given what the label declares and the order the list runs in. A plain percentage is one the label states outright.
- 1 moderate
- 1 watch
- 4 not rated
- 2 no concern
- 2 benefit
- 1Cooked Chickpeas52%Not rated
No published position is recorded here for this ingredient. That is a gap in this register, not a statement that it is fine.
Open Food Facts ingredient taxonomy
- Water52%No concern
Water.
Open Food Facts ingredient taxonomy
- Chickpeas≤ 50%Benefit
Counts toward the fruit, vegetable and legume component that earns positive Nutri-Score points.
Nutri-Score 2023 algorithm
- 2Water≤ 50%No concern
Water.
Open Food Facts ingredient taxonomy
- 3Tahini Sesame Seed Paste13%Not rated
No published position is recorded here for this ingredient. That is a gap in this register, not a statement that it is fine.
Open Food Facts ingredient taxonomyNot in the Open Food Facts taxonomy
- 4Rapeseed Oil≤ 13%Benefit
Predominantly unsaturated fat, which is what WHO recommends saturated fat be replaced with.
WHO guideline on saturated fatty acid intake, 2023
- 5Concentrated Lemon Juice≤ 13%Not rated
No published position is recorded here for this ingredient. That is a gap in this register, not a statement that it is fine.
Open Food Facts ingredient taxonomy
- 6Salt≤ 13%Moderate
WHO recommends adults consume less than 5 g of salt a day, which most populations exceed.
WHO guideline on sodium intake, 2023
- 7Garlic≤ 13%Not rated
No published position is recorded here for this ingredient. That is a gap in this register, not a statement that it is fine.
Open Food Facts ingredient taxonomy
- 8Potassium Sorbate≤ 12.5%Watch
EFSA reduced the acceptable daily intake in 2015 and noted exceedance in some groups.
At most 12.5% of the product, because its place in the ingredient list puts it at no more than 12.5%.EFSA opinion, 2015E202 · preservative
Show the text as printed
Cooked Chickpeas (52%) (Water, Chickpeas), Water, Tahini Sesame Seed Paste (13%), Rapeseed Oil, Concentrated Lemon Juice, Salt, Garlic, Preservative: Potassium Sorbate.
Percentages marked est. are Open Food Facts’ estimate from the order and the declared figures, not numbers off the pack. An ingredient marked not rated is a gap in this register rather than a clean bill of health.
How this number was made
77/100
Good
- Nutri-Score
- b
- NOVA
- 3 of 4
- Additives
- 1
Nutrition carries 55% of the weight and scores 80 out of 100, so it decides this almost on its own.
Nutrition
55% × 80
Additives
25% × 90
Processing
20% × 50
Column width is the weight you set. Column height is that axis out of 100. The shaded area is the score.
NutritionGrade B · 1 points80/100+44.0
Counts against it
- Energy927 kJ per 100 g2/10
- Sugars0.9 g per 100 g0/15
- Saturated fat1.7 g per 100 g1/10
- Salt0.65 g per 100 g3/20
Counts for it
- Protein6.7 g per 100 g2/7
- Fibre4.9 g per 100 g2/5
- Fruit, vegetables and legumes56.6% of the product1/5
- Nutri-Score points6 negative − 5 positive = 1, which Open Food Facts grades B
Higher points in the first block mean a worse food; higher points in the second mean a better one. Open Food Facts computes them with the 2023 Nutri-Score algorithm, and the grade band is stretched onto 0–100 here so the letter and the number always agree.
Additives1 declared · worst: limited90/100+22.5
- E202 · Potassium sorbateEFSA reduced the acceptable daily intake in 2015 and noted exceedance in some groups. (EFSA opinion, 2015) At most 12.5% of the product, because its place in the ingredient list puts it at no more than 12.5%, which is too much to discount the penalty.10/100
ProcessingNOVA 350/100+10.0
- NOVA group 3 of 4Processed food: a group 1 food with salt, sugar, oil or a preservative added.50/100
Organic labelNone on record0 · unweighted
- No organic certification foundOrganic certification describes how the food was farmed, not what is in it. This axis is weighted 0 by default for that reason.0/100
Additive records: E202
Panel, per 100 g
| Energy | 224kcal |
|---|---|
| Fat | 16g |
| of which saturates | 1.7g |
| Carbohydrate | 10.7g |
| of which sugars | 0.9g |
| Fibre | 4.9g |
| Protein | 6.7g |
| Salt | 0.65g |
Within its own category
Compared against classic hummus rather than against all food. A low absolute score on olive oil or nuts is a known Nutri-Score artefact; the useful question is how this compares to the other things on the same shelf.
Loading the category…
Product data from Open Food Facts, licensed ODbL. Open this record to correct or complete it.
Compare
The decision in an aisle is comparative. Open a second product and it lands beside this one, or share this URL with ?vs= and another barcode.